On-Time Arrival Report
This report shows how punctually your buses reach schools over a date range you choose. You can read it arrival by arrival, or rolled up by school, route, vehicle, group, or itinerary.
Who uses this: transportation operations and district administrators.
Where to find it
Go to Analytics & Reports in the sidebar, open the On-Time Arrival tile, then choose Arrival Report.
For the charts version of the same data, see Arrival Analytics.
Load the report
The screen opens empty, because it needs to know which period you're asking about.
- Pick a date range. It starts at one month.
- Select Load Report.
You'll see how many records came back. Loading clears any filters you had set, so set the range first and filter afterwards.
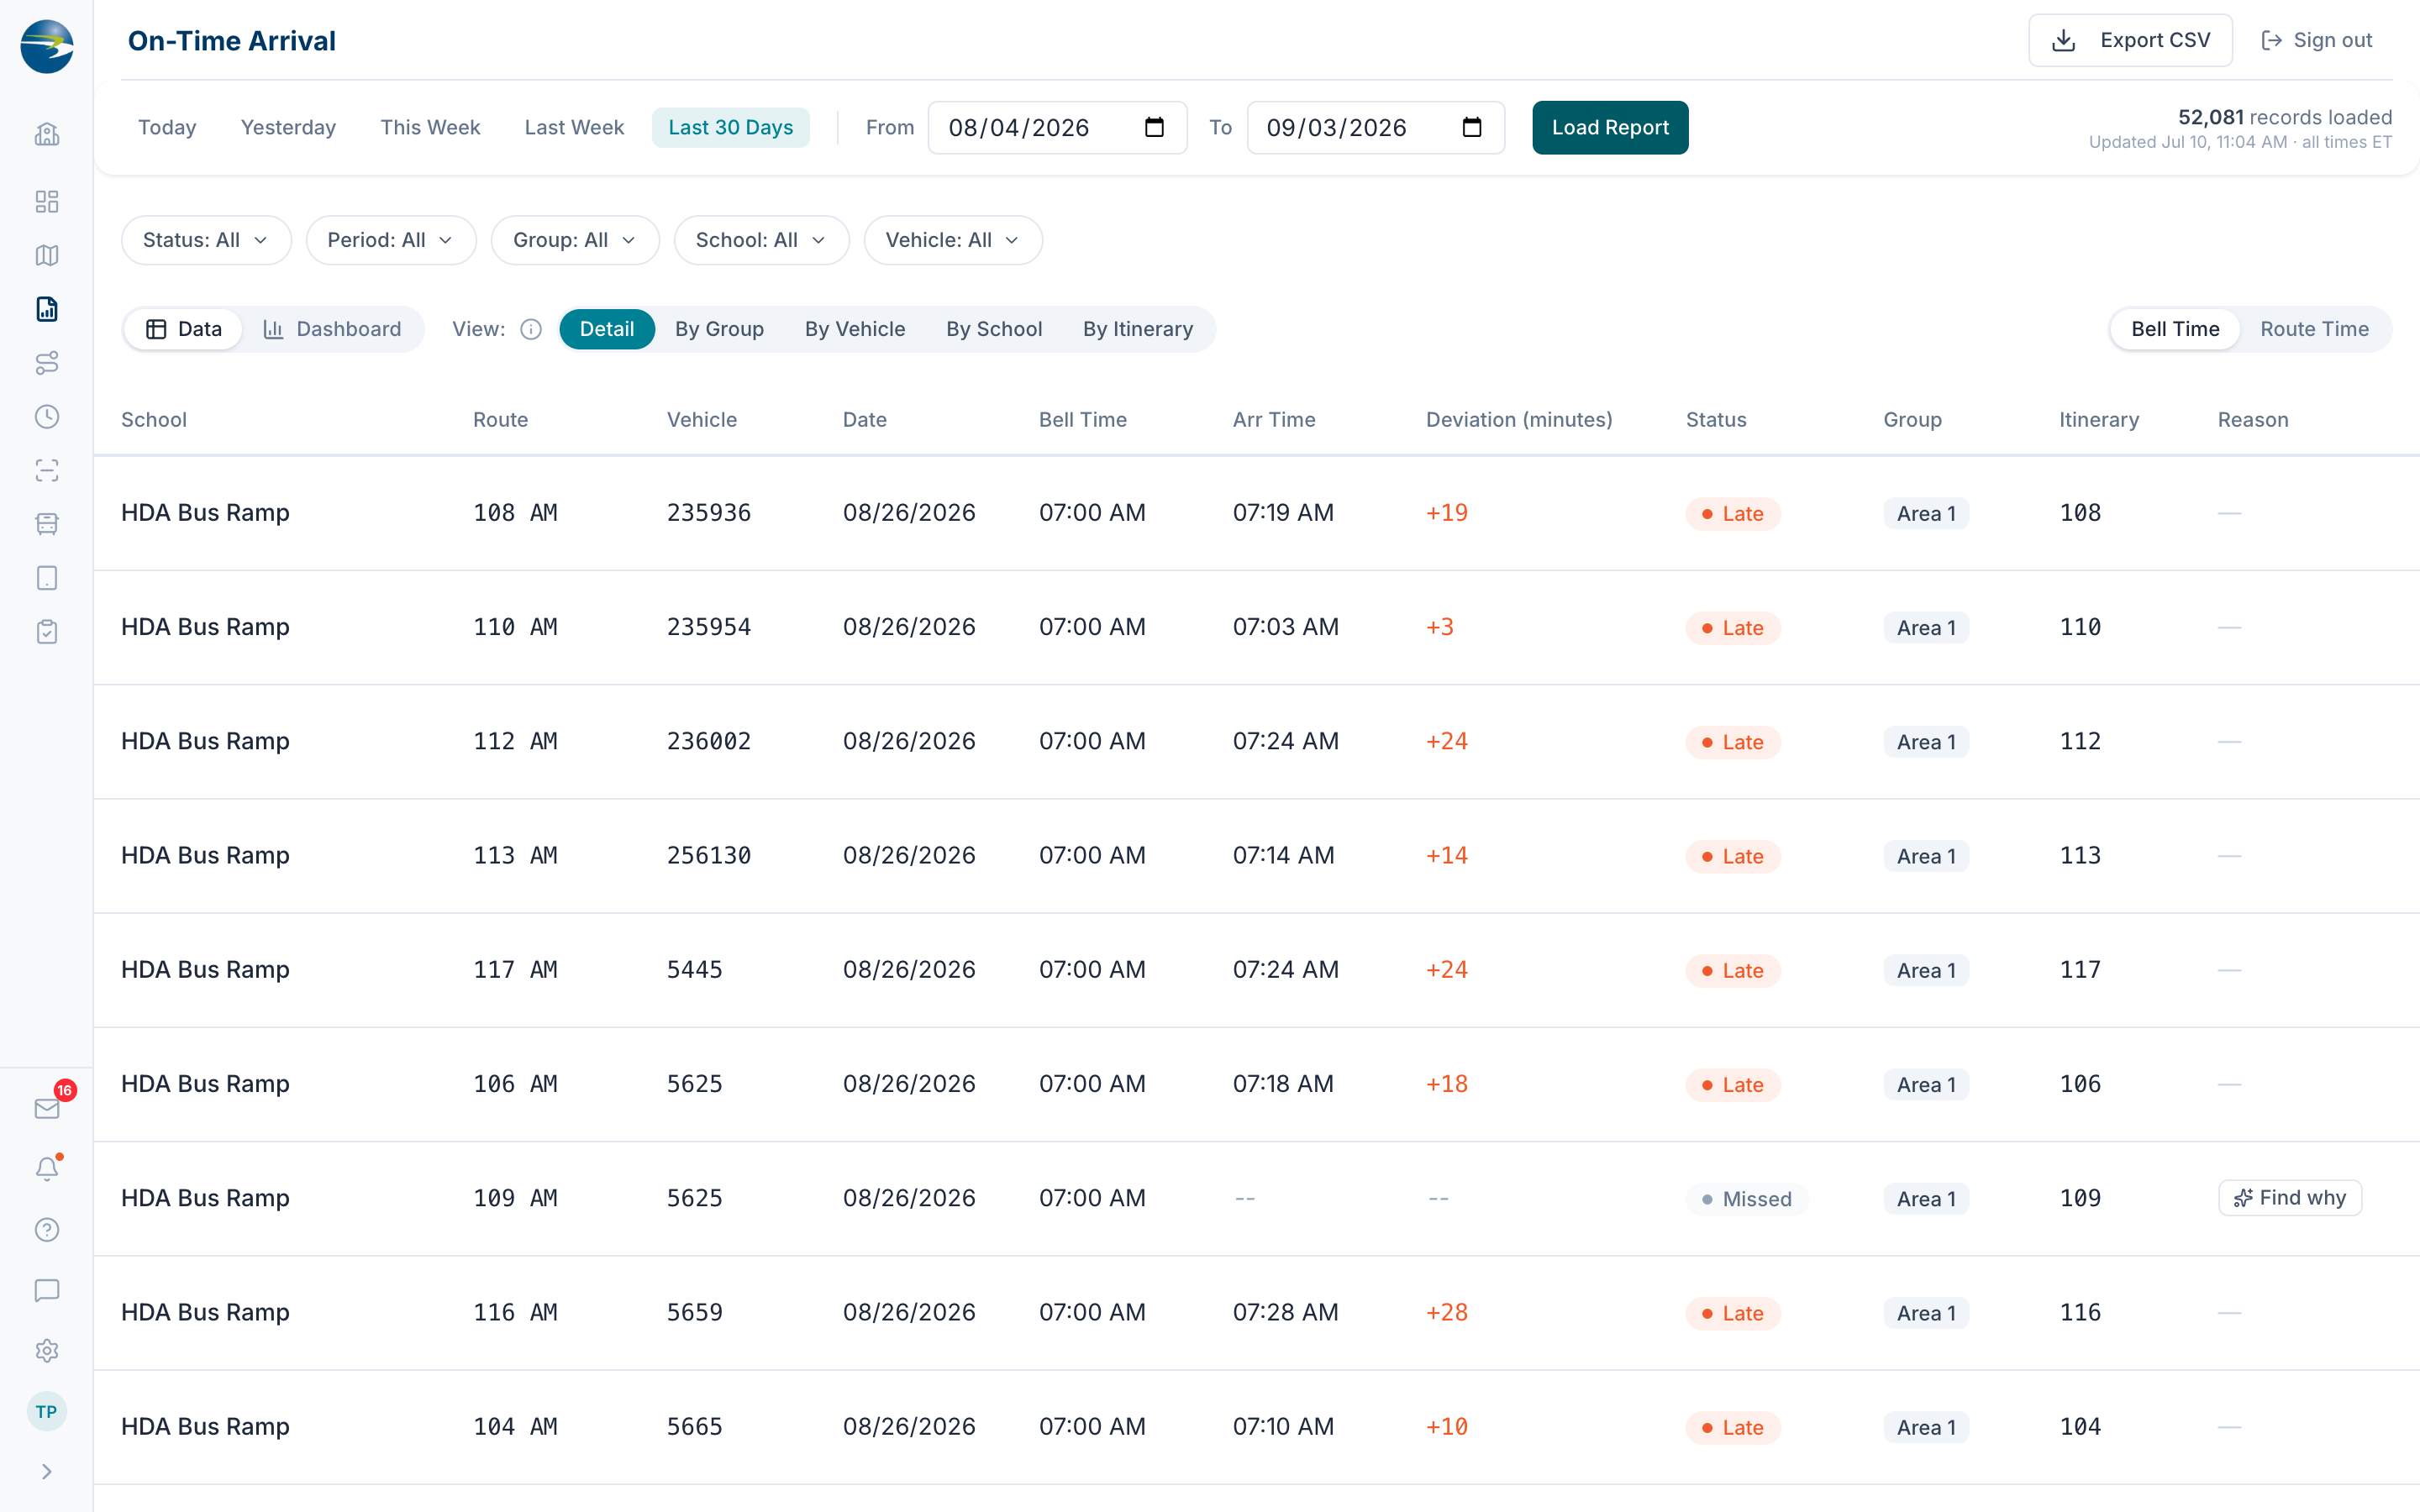 The On-Time Arrival Report, detail view.
How arrivals are graded
Every arrival is already classified before it reaches this report:
| Status | Meaning |
|---|---|
| Early | Arrived well before the bell, more than about 15 minutes |
| On Time | Arrived within the on-time window of the bell |
| Late | Arrived after the bell |
| Missed | No arrival was recorded at all |
Deviation is the number of minutes between planned and actual arrival. Negative is early, positive is late, and it's blank for a missed arrival.
Choose a view
Date presets — Today, Yesterday, This Week, Last Week, Last 30 Days — sit beside the From and To boxes if you'd rather not pick dates by hand.
The View toggle changes what a row represents:
- Detail — one row per arrival, with school, route, vehicle, date, bell time, arrival time, deviation, status, group, itinerary, and reason.
- Group, Vehicle, School, Itinerary — one row per that thing, with totals for each status, Arrived %, On Time %, average deviation, and a bar showing the mix.
Grouped views are the ones to use when you're looking for problems. Arrived % reads as healthy at 80% or above and concerning below 65%, and unusually high late or missed counts are highlighted.
Filter it down
Filter by Status, Period (AM, PM, MID), Group, School, and Vehicle. All allow several selections at once. When a filter is on, you'll see "Showing X of Y arrivals" and a Clear All link.
Note
The Group and Vehicle filter options come from the arrivals in the period you loaded, not from your district's current list. A route retired in March won't offer itself as an option for a report covering May.
Bell Time or Route Time
The Timing basis toggle switches the planned and actual columns between bell time and route time.
Note
This changes which columns you see, nothing else. Deviation and status are always measured against bell time, whichever basis you're viewing.
Export
On the Data view, Export CSV downloads exactly what's on screen — the view you've chosen, your active filters, and the current sort. Load a report first; exporting before that prompts you to.
Switch to Dashboard and the button becomes Export PDF, which captures the charts instead. See Arrival Analytics.
Good to know
- Rows show 20 at a time, and column headers sort.
- A missed arrival shows
--where the arrival time would be, and a Find why button in the Reason column that looks into what happened on that run. - Arrived % excludes missed arrivals; On Time % counts on-time arrivals against the total.
- Arrivals still appear correctly even if the route, vehicle, or group has since been deleted — the report keeps the names as they were at the time.